Using big data to answer big questions
October 21, 2021

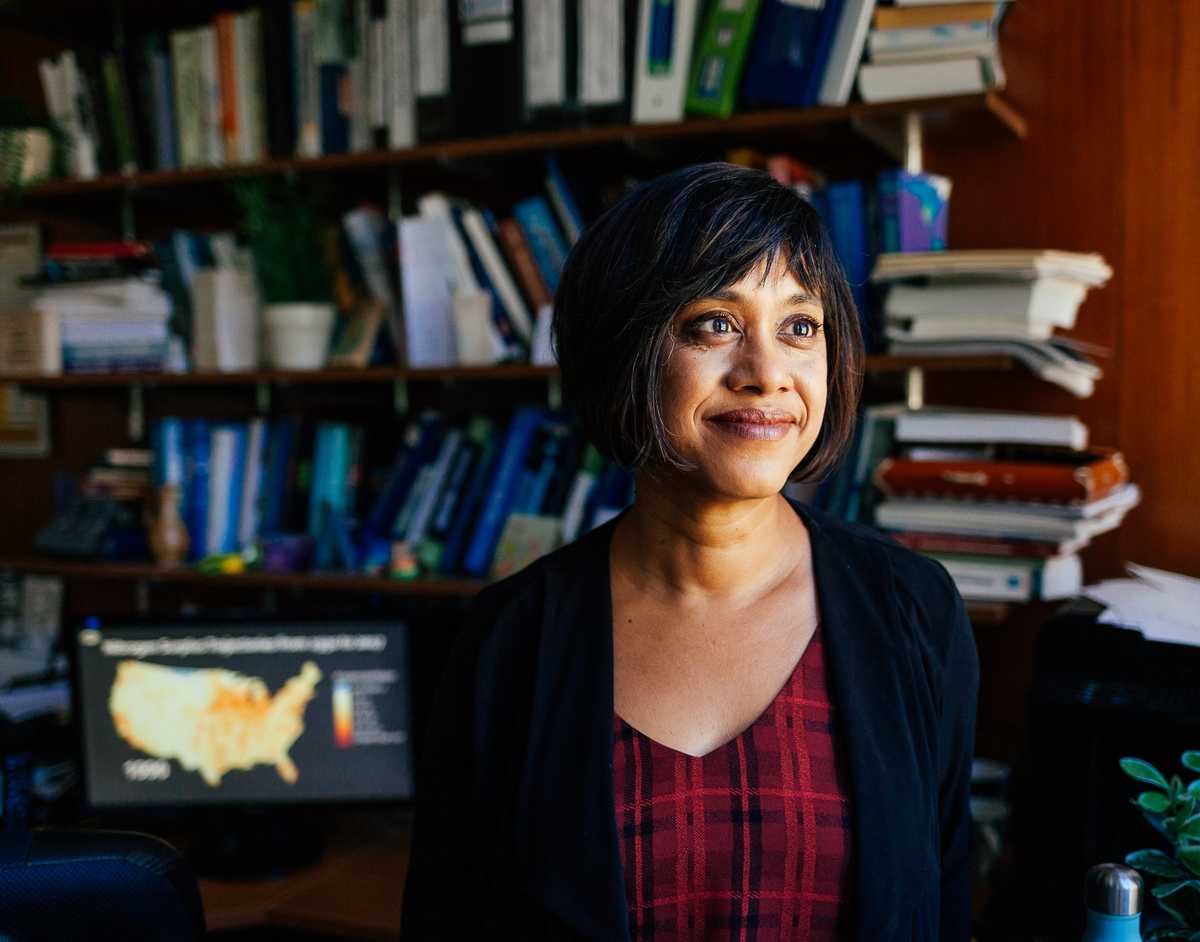
Dr. Nandita Basu is a Professor and University Research Chair in Global Water Sustainability and Ecohydrology at the University of Waterloo
As a water researcher at the University of Waterloo, Dr. Nandita Basu creates models to help answer big questions. How well do wetlands protect against algal blooms? Where are the biggest hotspots for agricultural runoff? How is climate change affecting water quality?
However, her models are only as good as the information she feeds into them. “The biggest thing about modelling is the data,” says Basu, who holds a University Research Chair in Global Water Sustainability and Ecohydrology.
During her academic career in the U.S., Basu had access to a national repository of water data from more than 400 state, federal and local agencies. But when she moved to Ontario in 2013, her work became more challenging.
Splintered data
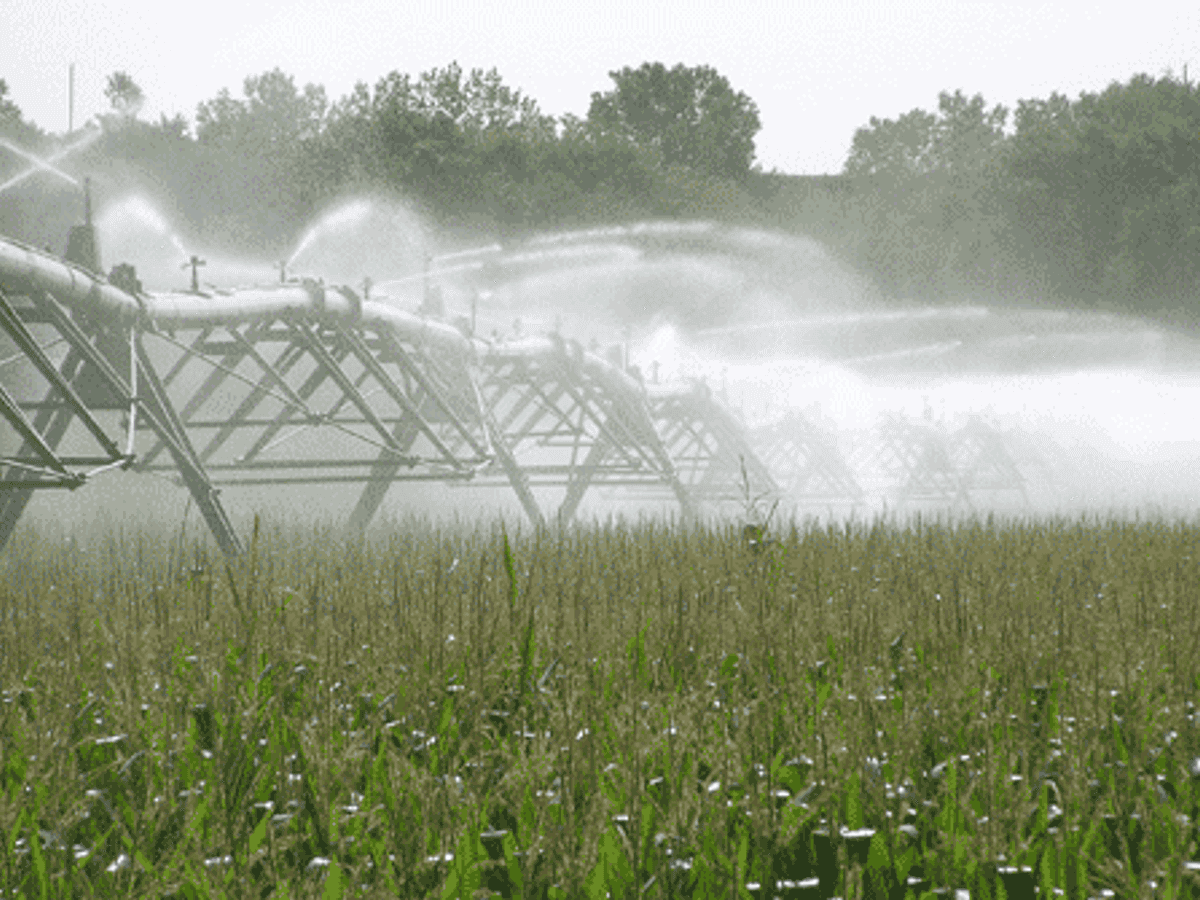
Instead of logging into a one-stop portal, Basu and her grad students have been forced to track down datapoints from a hodgepodge of sources. Sometimes provincial sites have the information they need. Other times, they have to wade through reports from conservation authorities or municipalities. “It’s tedious,” she says.
But securing data is just the first step. Next, the team must first clean up any “noise,” removing outliers, and addressing data inconsistencies to make apple-to-apple comparisons, they also need to ensure data from different sets are expressed the same way. If one source expresses nitrate as nitrate, while another expresses nitrate as nitrogen, for example, the researchers have to make conversions. On top of that, they’re often dealing with different file formats.
Another challenge is connecting different datapoints. Nutrient levels might be tested at one spot along a river, but the water flow rates are measured at a different place or time, making it difficult to get an accurate picture of pollution loads.
And that’s if they can find the information in the first place. One watershed might have consistent year-to-year stats, while a neighbouring jurisdiction has many gaps. Some of those holes can be filled using mathematical calculations. But the sparser the data, the less confident you can be about the analysis.
A better way forward
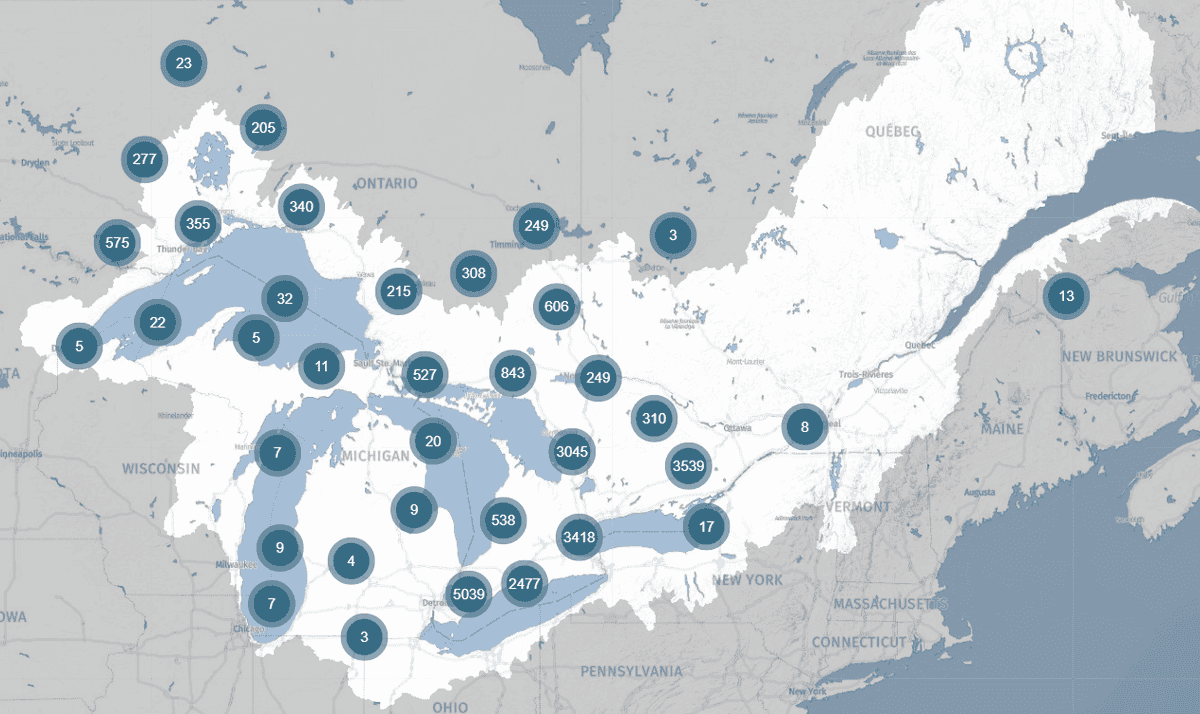
DataStream promises to make life easier for Basu and her colleagues. In fall 2021, the release of the latest regional hub, Great Lakes DataStream, will bring together water quality datasets throughout the Great Lakes and Saint Lawrence Basin in a standardized format. And to enable cross-border comparisons, that format is aligned with the U.S. water quality repository. “Harmonizing these different datasets together is immensely valuable,” says Basu.

Great Lakes DataStream brings together water quality data from across the Great Lakes-St. Lawrence Basin
Ultimately, the new DataStream hub will help researchers like her create insights into maintaining and improving water quality — insights that could help a municipality decide how big to build their water treatment plant. Or let farmers know the best time to apply fertilizer. Or pinpoint aquatic ecosystems that need added protection.
“As long as you have agriculture, as long as you have people, you’re going to have excess nutrients in streams,” Basu points out. “So how do you live sustainably while protecting the environment in that landscape?”
It’s a big question, and one she hopes her models will help answer — with a little support from DataStream.
The results are in! DataStream's 2023 external evaluation
We asked for your feedback, and you delivered! DataStream is pleased to share the results of our 2023 external evaluation.
Job Posting: Executive Director
The Executive Director (ED) will play a pivotal role in leading DataStream at an exciting time of growth.
Join DataStream's Pacific Data Drive
Do you collect water quality data in British Columbia or the Yukon? If YES, we want to work with you!


